
What the old map was actually measuring
For roughly two decades, the FCC's Form 477 data-collection process asked providers to report coverage at the census-block level. The logic was administrative convenience: blocks are enumerable, providers know their footprints, the math is simple. The problem is that a census block can contain hundreds of addresses, and the rule required only one of them to be reachable before the entire block was checked served. A cable headend serving the first house on a long rural road made every unserved house behind it, sometimes miles back, an official success story.
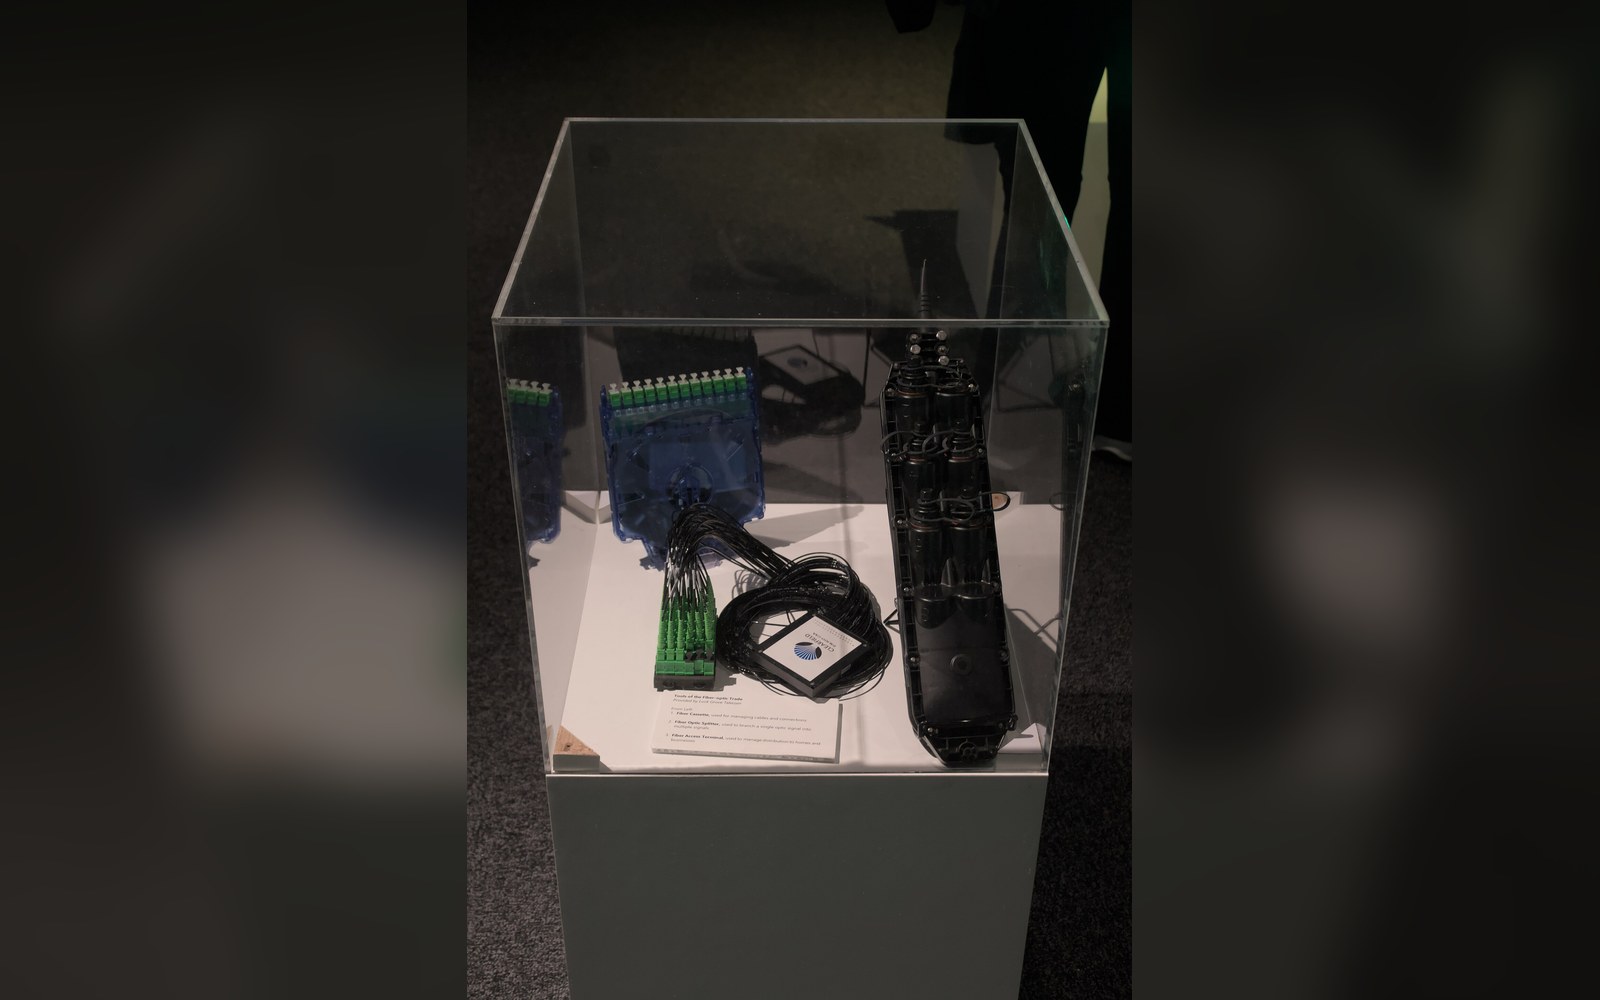
The consequences compounded over time. States planning infrastructure investment, counties applying for federal grants, and the NTIA distributing funds under successive broadband programs all worked from maps that overstated coverage in ways nobody could easily quantify. The overcounting was not random noise; it was structurally biased toward marking rural and exurban areas served when the plant simply did not reach them. A provider's home-passed count — the internal figure that actually drives capital allocation — bore little resemblance to the published coverage polygon.
The fabric and what it replaced
The FCC's Broadband Data Collection, which began displacing Form 477 data in 2022, is built around what the agency calls the broadband fabric: a database of individual serviceable locations rather than census blocks. Each entry represents a structure — a house, an apartment building, a business premises — that a technician could, in principle, connect. The fabric was constructed by Costquest Associates under contract, using a combination of parcel records, building footprints, address databases and field verification. As of the first national release, it contained more than 110 million locations across the United States.
Chronology
- ~2000–2022Form 477 census-block reporting era; one household served counts the whole block
- 2021Infrastructure Investment and Jobs Act authorizes $42.45 billion BEAD program via NTIA
- 2022FCC Broadband Data Collection begins displacing Form 477; fabric goes live
- 2022 onwardFirst fabric release: 110+ million individual serviceable locations nationally
- 2022 onwardState challenge campaigns begin recovering locations into BEAD-eligible pool
The shift is fundamental. Instead of asking whether a provider's service territory overlaps a block, the system asks: does this provider's network pass this specific address, and at what technology and speed? Providers submit availability at the location level, and the resulting map is a point cloud rather than a polygon layer. Where the polygon obscured the gap between the road and the back of the property, the point layer either has a dot or it does not.
Loudoun County, Virginia illustrates the before and after in useful miniature. Loudoun is simultaneously one of the wealthiest counties in the country and home to large stretches of exurban and agricultural land where fiber deployment has been uneven. Under the old Form 477 system, much of that land was counted served because a provider's network touched part of a block. The fabric-based maps, when they became available, resolved addresses that had never in practice been reachable — properties that could not get a connection regardless of what the map said. The county's own broadband planning process had to reconcile two entirely different pictures of the same geography.
How providers filed, and what challenges revealed
The new system requires providers to file at hexagonal tile and location level, and the filings arrived with their own distortions. Some providers carried forward the habit of generous interpretation from the Form 477 era, marking locations passed when the plant was close but not actually terminating at the structure. AT&T's fixed-line filings, covering both its fiber and its residual copper DSL infrastructure, drew challenges in several states where the company had claimed locations that were either beyond the service boundary or served only by a technology already being wound down. The challenge process — slower and more procedurally demanding than the filing process — is how errors surface after the fact.
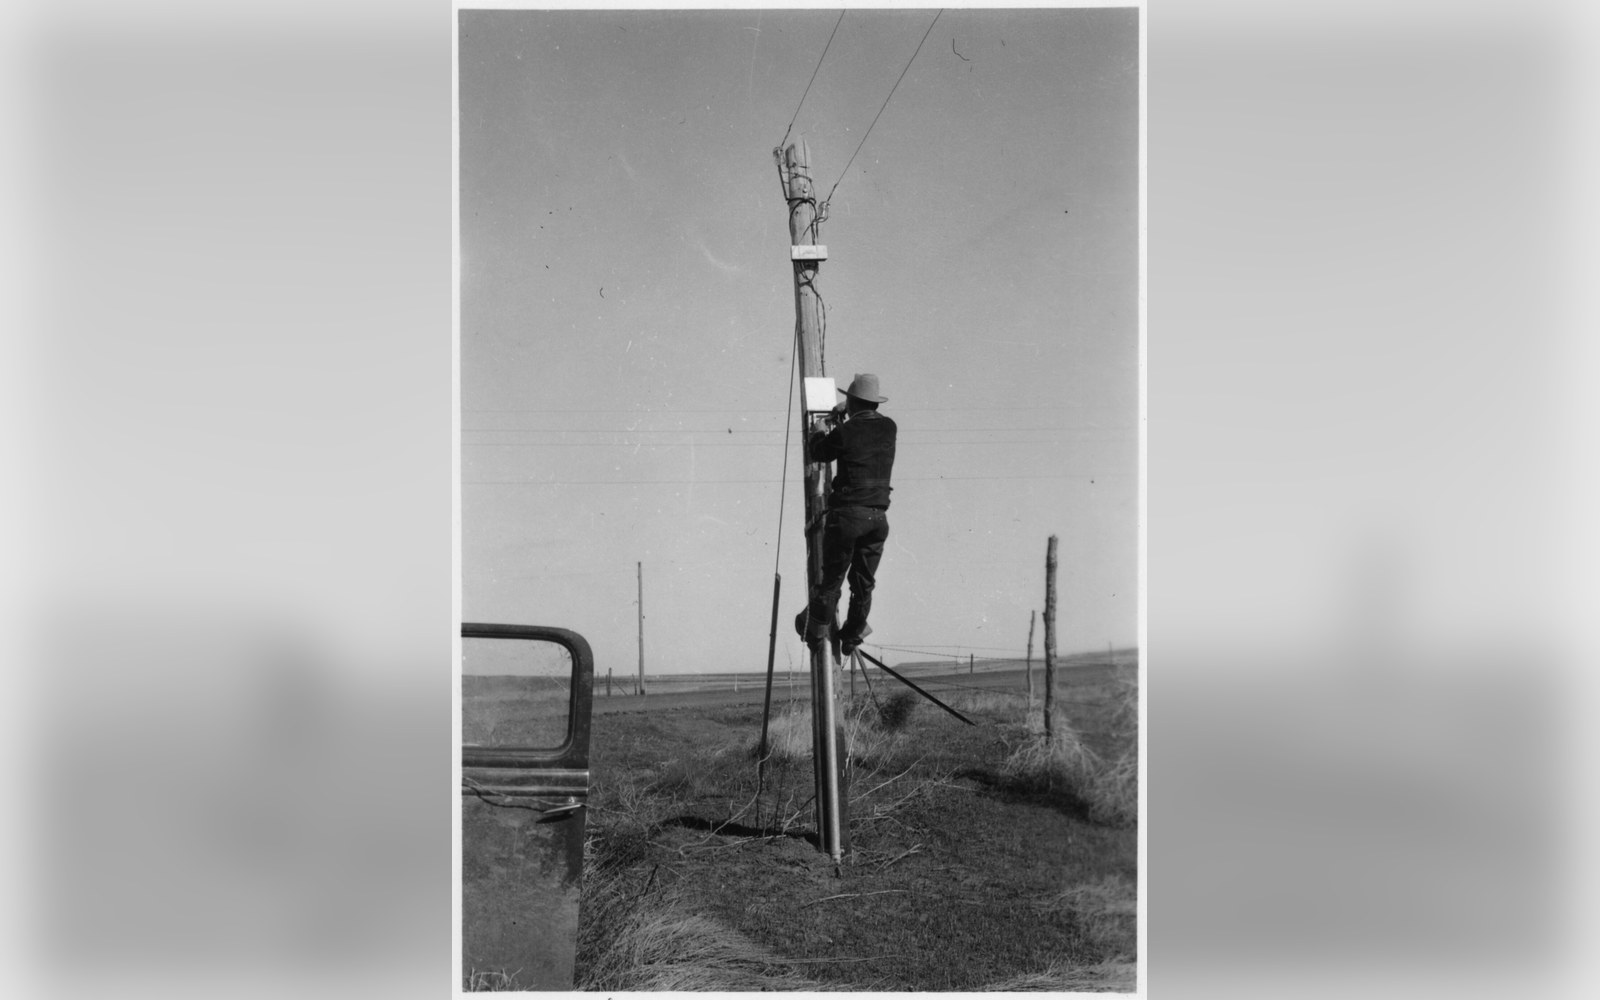
That challenge dynamic is revealing. When a municipality or a state broadband office compares the provider's claimed coverage against its own address-level permit and assessment data, the discrepancies are often consistent in direction: claimed coverage tends to extend further than actual coverage, and the gap is widest at the edges of cable and DSL service areas rather than at the core. A DOCSIS network, built originally to deliver television to a bounded franchise area, has a headend and then a distribution tree; at the leaves of that tree, the signal is marginal and the homes passed claim is often optimistic. A GPON fiber deployment, by contrast, tends to be filed conservatively because the operator has a precise record of every optical network terminal it has activated — the physics of the passive optical network leave little ambiguity about what is and is not on the tree.
| Census block (old) | a polygon; one reachable address makes the whole block "served" |
| Broadband fabric (new) | a point per structure; each address is present or absent |
| GPON filing | tends to be precise; operator knows every activated terminal on the passive tree |
| DOCSIS filing | prone to edge optimism; homes passed at signal margins are often overcounted |
| DSL filing | speed degrades with loop length; filed tier may not match achievable rate |
The NTIA's BEAD program, distributing $42.45 billion in infrastructure funding authorized by the Infrastructure Investment and Jobs Act of 2021, uses the fabric-derived maps to determine which locations are eligible for subsidy. A location already claimed served at 100 Mbps downstream and 20 Mbps upstream by a provider is presumptively ineligible, regardless of whether the connection is real. States that accepted the map without running their own challenge campaigns inherited whatever errors the initial filings contained. States that invested in systematic challenge — comparing the FCC data against E911 address databases, county parcel records and utility hookup records — recovered substantial numbers of locations into the eligible pool, which directly increased the funding available for new builds in those areas.
The number that actually matters
The gap between claimed coverage and fabric-addressable locations is not uniform, and it does not sort cleanly by technology. It is worst where deployment economics were always worst: long distances between structures, low housing density, terrain that makes trenching expensive. Those are precisely the areas where the old Form 477 system was most likely to register a provider's nearby presence as coverage of addresses the provider had no intention of serving. The fabric exposed that pattern at scale for the first time.
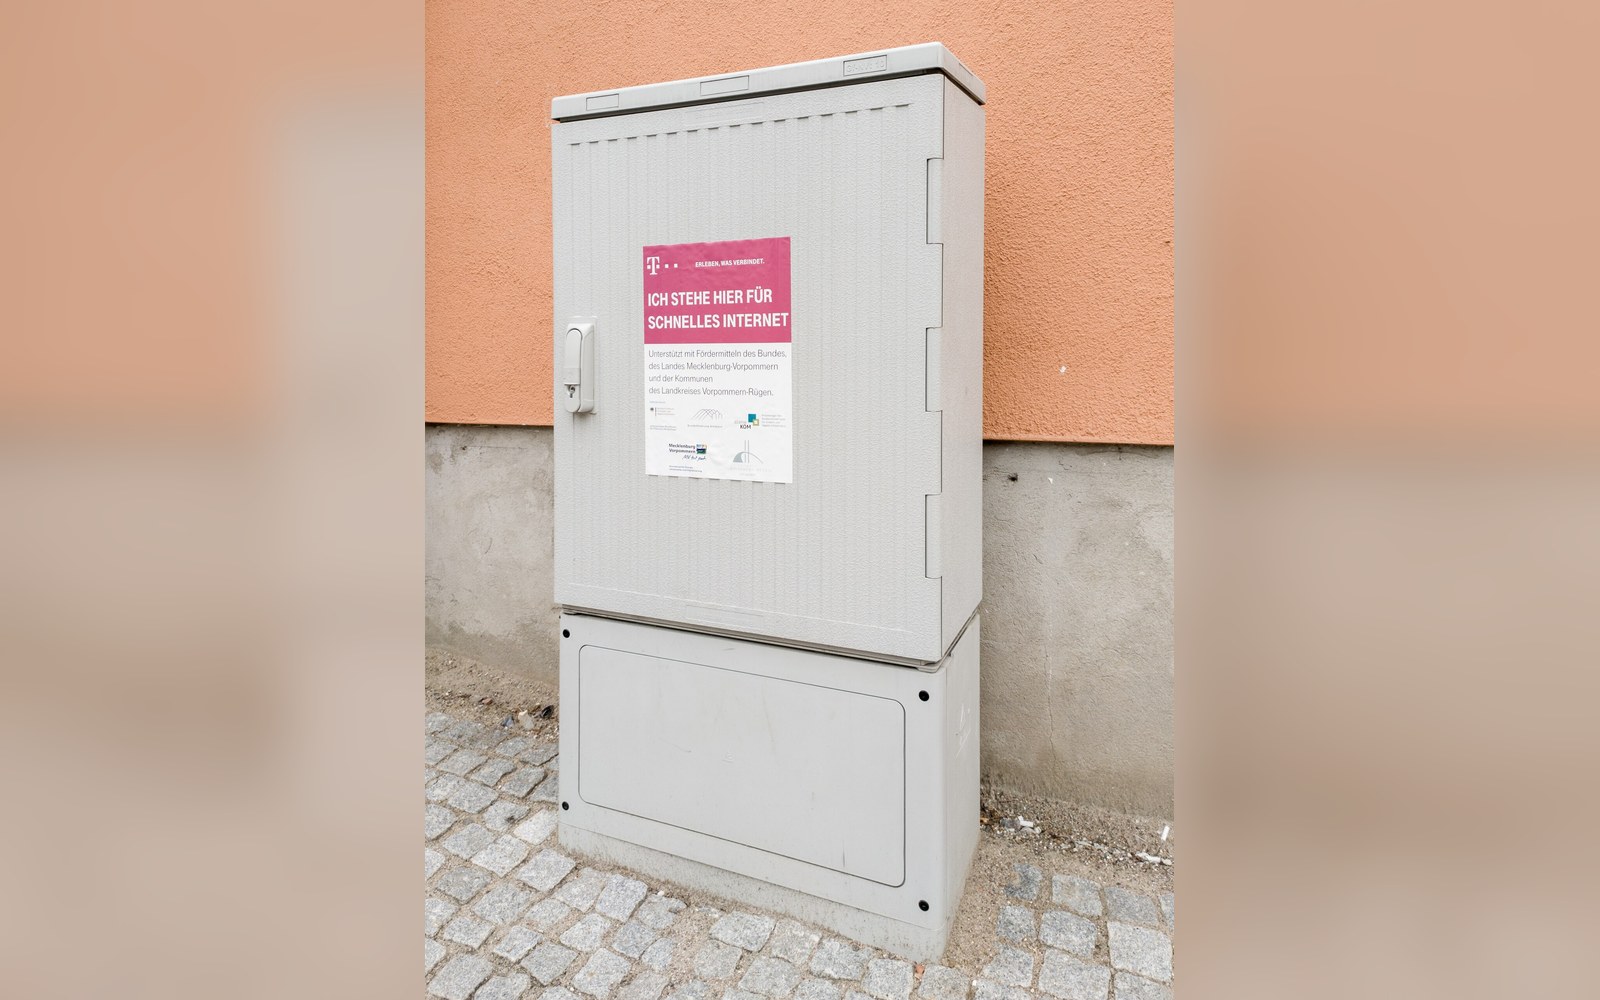
What the fabric cannot resolve on its own is the speed claim layered on top of the location claim. A provider can accurately file that a location is passed by its network and simultaneously overstate the speed that location can actually achieve. A home at the far end of a long copper loop is on the DSL map, genuinely — but the theoretical maximum of that loop degrades with distance in ways that the filed speed tier does not always reflect. The same is partly true at the edge of a cable plant where the downstream signal is strong enough for DOCSIS to train, but the upstream path is constrained. Measured speed at the location and claimed speed at filing can diverge substantially.
The fabric is a better instrument than what it replaced, and the location count is a more honest denominator than the block-based polygon ever was. But the map is only as accurate as the filings that populate it, and filings are still self-reported by the entities with the most financial interest in being counted served. The challenge mechanism exists because that interest is real and the errors are predictable. A location the map calls served, and a location a technician can actually connect, are closer together now than they were in 2020. They are not the same thing yet.