
The last mile is rarely where the problem lives
When a subscriber calls to report a slow connection, the conversation almost always starts at the router and works backward: check the modem, check the coax, check the node. That is not an unreasonable place to start — the last mile does fail, and it fails in ways that are physical and localised and fixable. But a well-provisioned DOCSIS 3.1 cable plant or a GPON fibre drop can deliver its full rated throughput to the side of a house and still leave the subscriber watching a spinner. The bottleneck has simply moved. It is now somewhere in the network's interior, at a handoff point the subscriber cannot see and the technician dispatched to the street will not find.

The middle mile is the transport layer between a provider's access network — the last-mile plant, the headend or the optical line terminal — and the wider internet. It includes the provider's own backbone, the regional networks that carry traffic between cities, and the interconnect points where different networks hand traffic to each other. Any of those segments can degrade performance, but the failure mode that is hardest to diagnose and slowest to fix is congestion at an interconnect port: a physical interface, often a 10 Gb/s or 100 Gb/s Ethernet port in a colocation facility, that is simply being asked to move more bits than it was designed to move.
How a port becomes the bottleneck
Networks connect to each other in two ways. Peering is a settlement-free exchange between networks of roughly comparable traffic weight; transit is the purchase of connectivity from a larger network that agrees to carry your traffic anywhere on the internet. Both relationships terminate at physical ports, and those ports have a rated capacity. When sustained traffic approaches that capacity — during evening peak hours, during a major streaming event, during a period when one side of the relationship has grown faster than the other — the port saturates. Packets queue. Round-trip times climb. Throughput measured at the subscriber's device falls, sometimes sharply, even though every segment of the path between the headend and the house is operating normally.
| Last mile | physical plant between the headend and the subscriber premises; failures are localised and technician-accessible |
| Middle mile | backbone and interconnect layer; failures are commercial and capacity-driven, not physical breaks |
| Interconnect port | the physical Ethernet interface where two networks hand traffic; rated at a fixed capacity (commonly 10 Gb/s or 100 Gb/s) |
| Port saturation | sustained traffic at or near rated capacity; produces queue-induced latency and throughput loss, typically worst at evening peak |
This is not a theoretical failure mode. Between roughly 2012 and 2014, interconnection disputes between large content networks and residential broadband providers produced documented, measurable degradation on specific provider-to-provider paths. The FCC's 2014 Open Internet record included traffic measurement data showing sustained congestion on interconnect links that persisted for months, not hours. The congestion was not at the subscriber's modem. It was at ports in facilities like Ashburn, Virginia — where Loudoun County hosts one of the densest concentrations of data centre capacity in the world — and equivalent exchange points in other metro areas.
What made those episodes distinctive was duration. A fibre cut is repaired; a failed line card is replaced. A congested interconnect port persists as long as neither party upgrades it, and upgrading requires both commercial agreement and physical provisioning. A port in a colocation facility has to be ordered, cross-connected, tested and turned up. If the two networks are in a billing dispute about who funds the upgrade, the port stays congested while that dispute runs.
What the subscriber experiences, and why it is hard to attribute
Congestion at an interconnect produces a specific and recognisable pattern in measurement data, even if it is unfamiliar to most subscribers. Latency rises at predictable hours — typically early evening, when residential traffic peaks — and recovers overnight. Download speeds to servers on one network path are significantly worse than to servers on a different path, even though the tested download speed to a local server looks fine. The problem is directional and path-specific, which is why a speed test to a nearby server can show full line rate while a video stream from a CDN on the other side of a congested handoff buffers continuously.
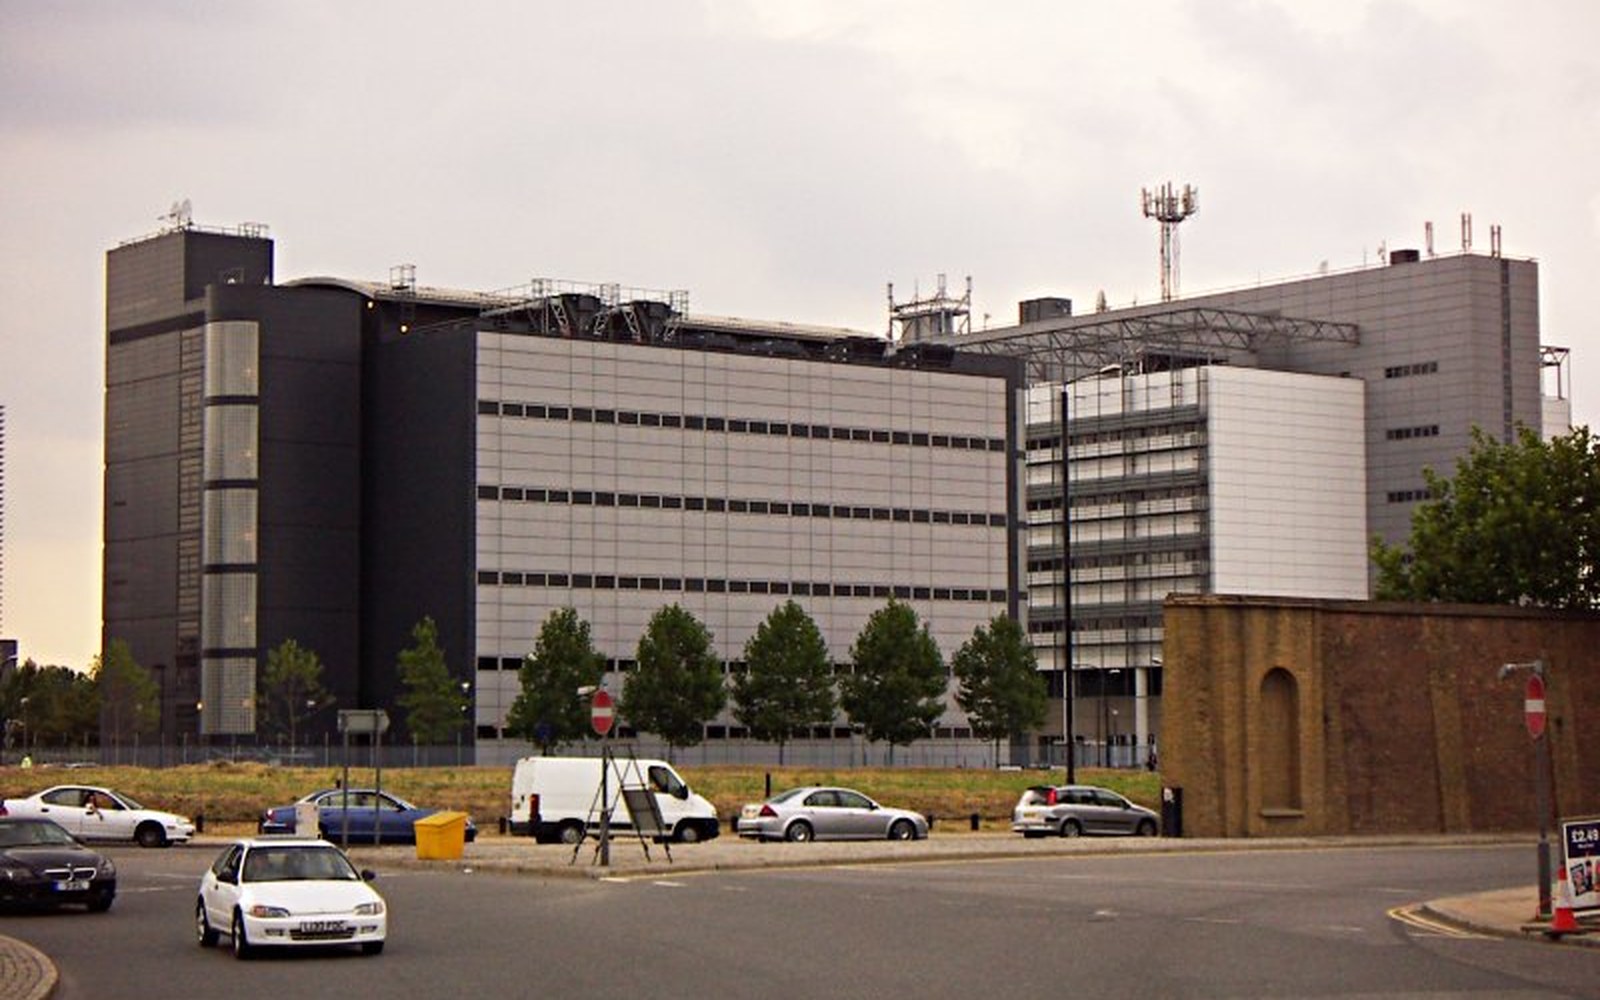
The FCC's Measuring Broadband America programme, which has run panel-based performance measurement since 2011, uses hardware probes installed at subscriber premises to separate last-mile performance from network-wide performance. That separation matters precisely because the failure modes are different and require different remedies. A degraded DOCSIS upstream is fixed by the cable operator's plant team. A congested transit port is fixed by a commercial negotiation between network operators — or by one of them building or buying a more direct path.
Chronology
- 2011FCC's Measuring Broadband America panel-measurement programme begins, separating last-mile from network-wide performance
- 2012–2014documented interconnect congestion disputes between large content and access networks produce measurable degradation on specific paths
- 2014FCC Open Internet record includes traffic measurement data on sustained interconnect congestion
- 2021Infrastructure Investment and Jobs Act requires NTIA to map middle-mile infrastructure by fibre route (not port-level capacity)
AT&T, for example, has operated both the access and the backbone layer for much of its footprint, which means some interconnect disputes play out internally. Carriers with less vertical integration are more exposed to external peering relationships and the politics that accompany them. A smaller regional ISP buying transit from a single upstream provider has essentially no leverage if that upstream port saturates — it can upgrade its purchase, which costs money, or it can add a second transit relationship, which also costs money and time.
Why the middle mile stays undercounted
Unlike the last mile, which the FCC has tried to map since the Form 477 era and is now rebuilding through the broadband fabric, the middle mile has no equivalent location-by-location inventory. The NTIA published a middle-mile mapping effort under the Infrastructure Investment and Jobs Act of 2021, which required identification of existing and planned middle-mile infrastructure to reduce duplicative builds and target subsidy. That map covers fibre routes, not port-level capacity — it can show that a fibre strand runs through a county without revealing whether the lit capacity on that strand is anywhere near exhausted.
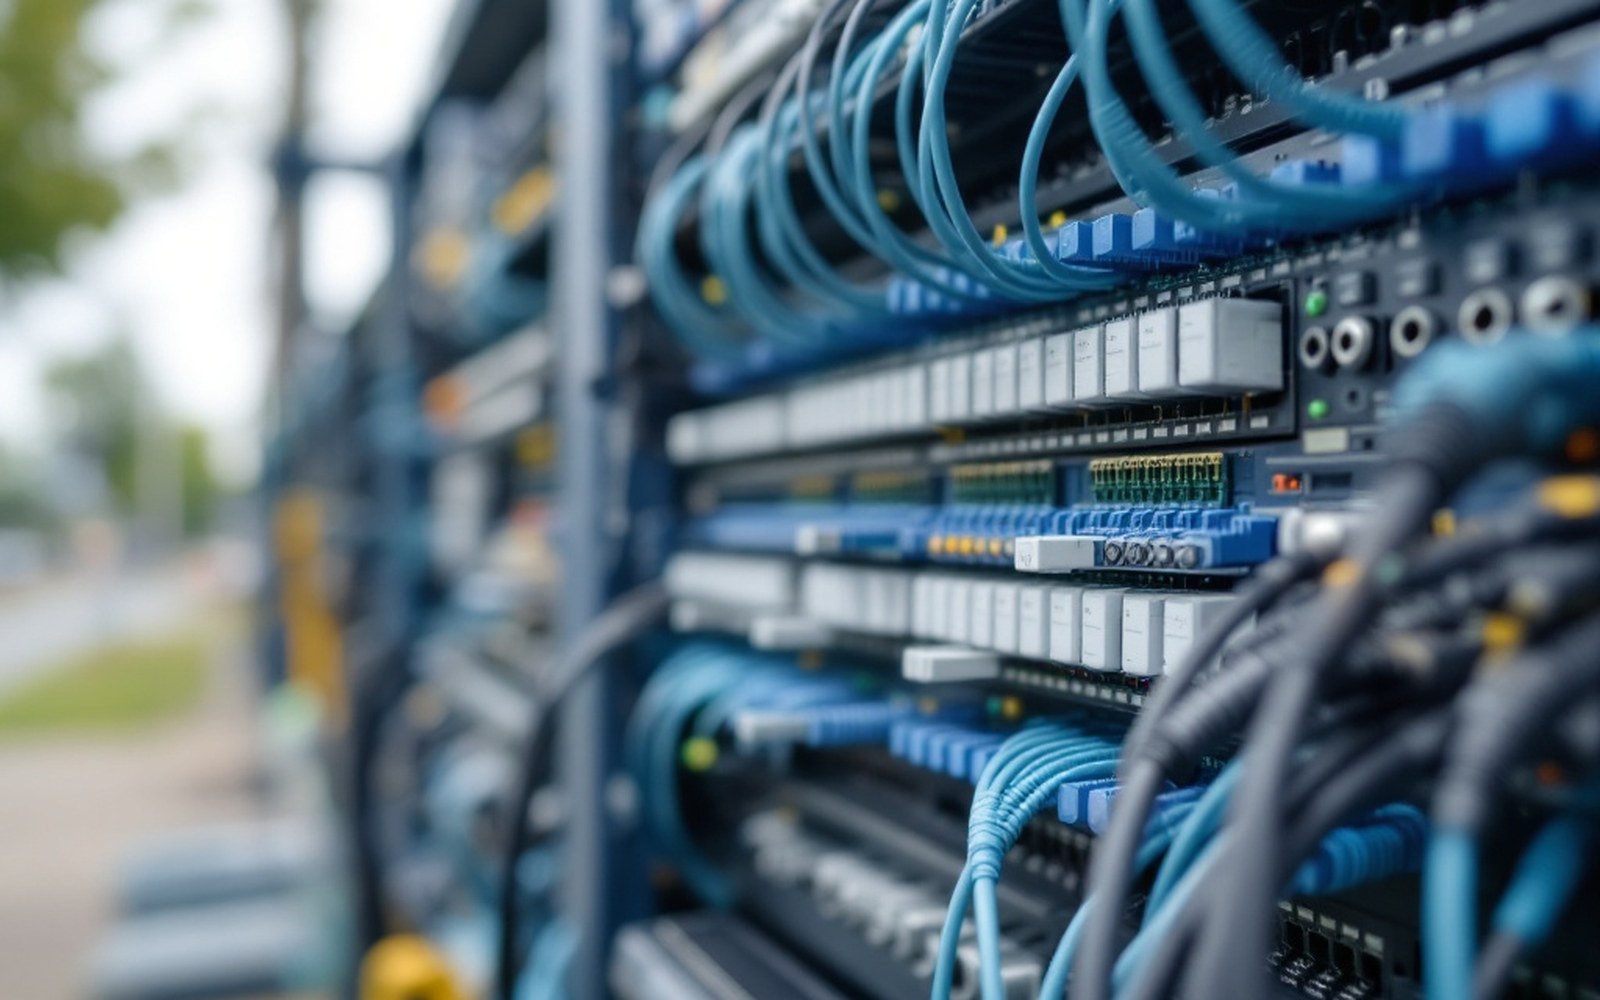
Port-level congestion, in other words, is structurally invisible to public data. It appears only in measurement programmes like Measuring Broadband America, in traceroute data collected by researchers, or in the disclosures that occasionally accompany regulatory proceedings. A subscriber in a county that appears well-served on every coverage map — fibre to the door, competitive providers, strong download speeds on the FCC's reported numbers — can still have their evening traffic bottlenecked at a 10 Gb/s port in a building two states away, and no map will show it.
The fix, when it comes, is unglamorous: a new cross-connect, a port upgrade, a renegotiated peering agreement. Nothing in the last mile changes. The spinner simply stops.